10|20 Marketing’s clients now have Google My Business metrics at their fingertips. Every month, we’re pulling location specific statistics straight from Google and making them available to you via Google Data Studio. Each dashboard is designed to help you see how your metrics are progressing every month, with comparisons to the previous month and trended for the most recent 12-month period.
The dashboards will also show an important comparison: your metrics before and after you subscribed to our services. And that’s what really gets us going! Because with these metrics, we’ll be able to show you the impact of owning, organizing and optimizing your Google My Business presence.
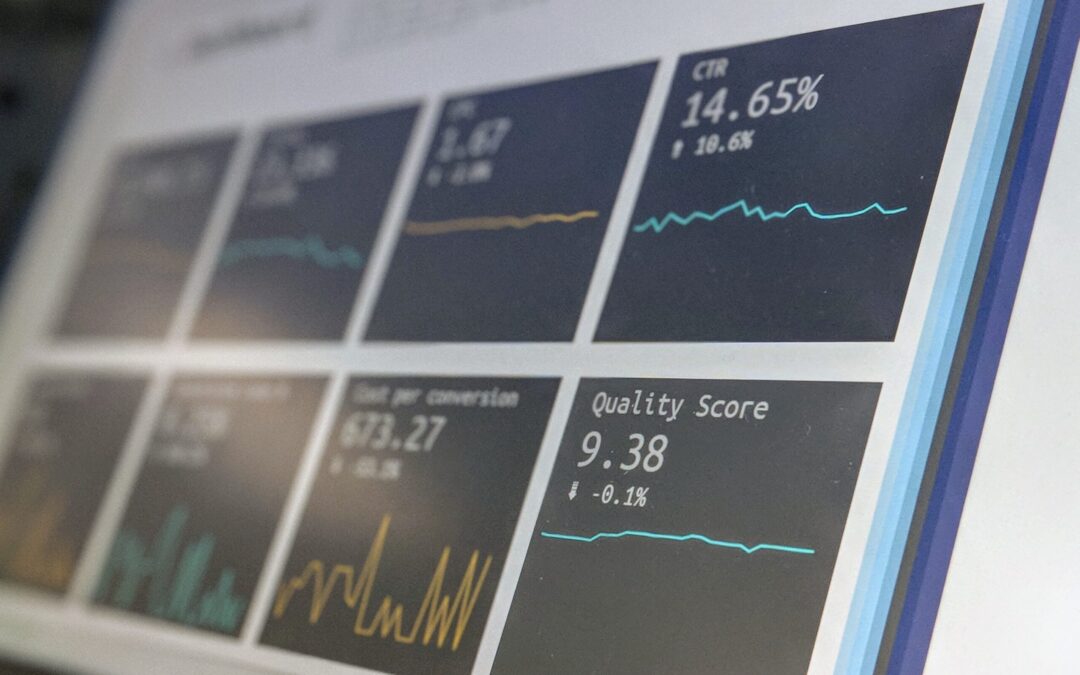
See an interactive sample of the new dashboard right now!
The Metrics You Will See
What will you learn when accessing your dashboard? We’ve mapped out the following:
- Total Views: Total number of times your Google My Business (GMB) listing has been viewed.
- Total Actions: Total number of times people clicked through to call, map your address or visit your website from your GMB listing.
- Action Rate: Total actions/total views. This shows the percentage of people who acted on your business information to learn more about your business.
- Map Views: The number of times your local listing appeared in the Google maps results following a query.
- Search Views: The number of times your local listing appeared in search results following a query.
- Calls: The number of calls initiated from your local listing on desktop or mobile.
- Directions: The number of times someone mapped your address from your local listing on desktop or mobile.
- Website Visits: The number of times someone visited your website after clicking from your listing on desktop or mobile.
Plus, for each metric, you’ll have two boxes below where you can review your monthly averages from before and after subscribing with us. This calculation has already helped us turn out some pretty impressive case studies, as the before/after snapshot shows us the impact we’ve had on our small business clients.
How To Read Your Dashboard
Reading the first page of your dashboard is key to understanding the impact we’ve had on your business. Here’s how to get the most out of your board.

- Use the navigation on the top left to change pages.
- Use the date filter to choose the month you’d like to review. New data is updated on the 12th of the following month.
- This is the date that you started working with 10|20 Marketing.
- The big number is the total for the selected time period. A comparison to the previous month is below and indicates whether the total has increased or decreased month over month.
- Each metric has a comparison of your business’s averages. The lighter blue box is your average prior to working with 10|20 Marketing and the darker blue box shows your average after working with us.
- Note: If there are no metrics for your Google My Business listing before you joined us, these comparison boxes will only show the average since joining 10|20 Marketing.
- The charts trend your total Google My Business views and actions. Hover your mouse over the bars to see your breakdown for each data point and your total for each respective month.
Optimizing Your Local Business Listings
Remember, there are several things you can do on your own to help your views, calls, website clicks and in-store visits improve. Here are some quick pointers on how to optimize your Google My Business listing and your presence on the other directories we’ve claimed for you.
- Always maintain consistency with all of your listings. If you have changes to make, please let us know so we can apply the same change to all of the listings in your package.
- Keep on top of your online reviews. Thank your customers for their positive reviews and help solve the issues related to negative reviews. Show your clients – and everyone who reads your reviews – that you’re responsive and care.
- Update your Google My Business listing with social posts. The content associated with your posts will be indexed by Google and help you increase the number of views your listing attracts.
- Post pictures to your listing and name these images with the terms that best describe what is in the image, along with your business name.
- Answer any questions that may be posted to your listing. You’ll receive an alert for these. Answering these questions help your customers learn more about your business.
- Update your business description for Google. You have 750 characters to use for your description, so fill this space with the keywords that best describe the services or products that you offer. This description helps your listing index with Google as well.
We’re happy to answer your questions or arrange to help you with these optimizations as an addition to your service contract with us. We’ve helped many businesses just like yours increase the views of their listing and the total number of calls, website visits and clicks on directions — all to increase sales.
Alerts Coming Your Way
When you sign up with 10|20 Marketing, we’ll be sure to send you an introduction with a link to your dashboard. You can bookmark it or wait for your reminder to arrive in your inbox every month. You’ll be pointed to your metrics directly from the email.
If you have any questions, feel free to reach out. We’re happy to walk you through the metrics and help you understand how to optimize further!